Discover 10 simple ways to spot high-volume options contracts. Learn how to use free websites and broker scanners, with clear examples and tips for beginners.
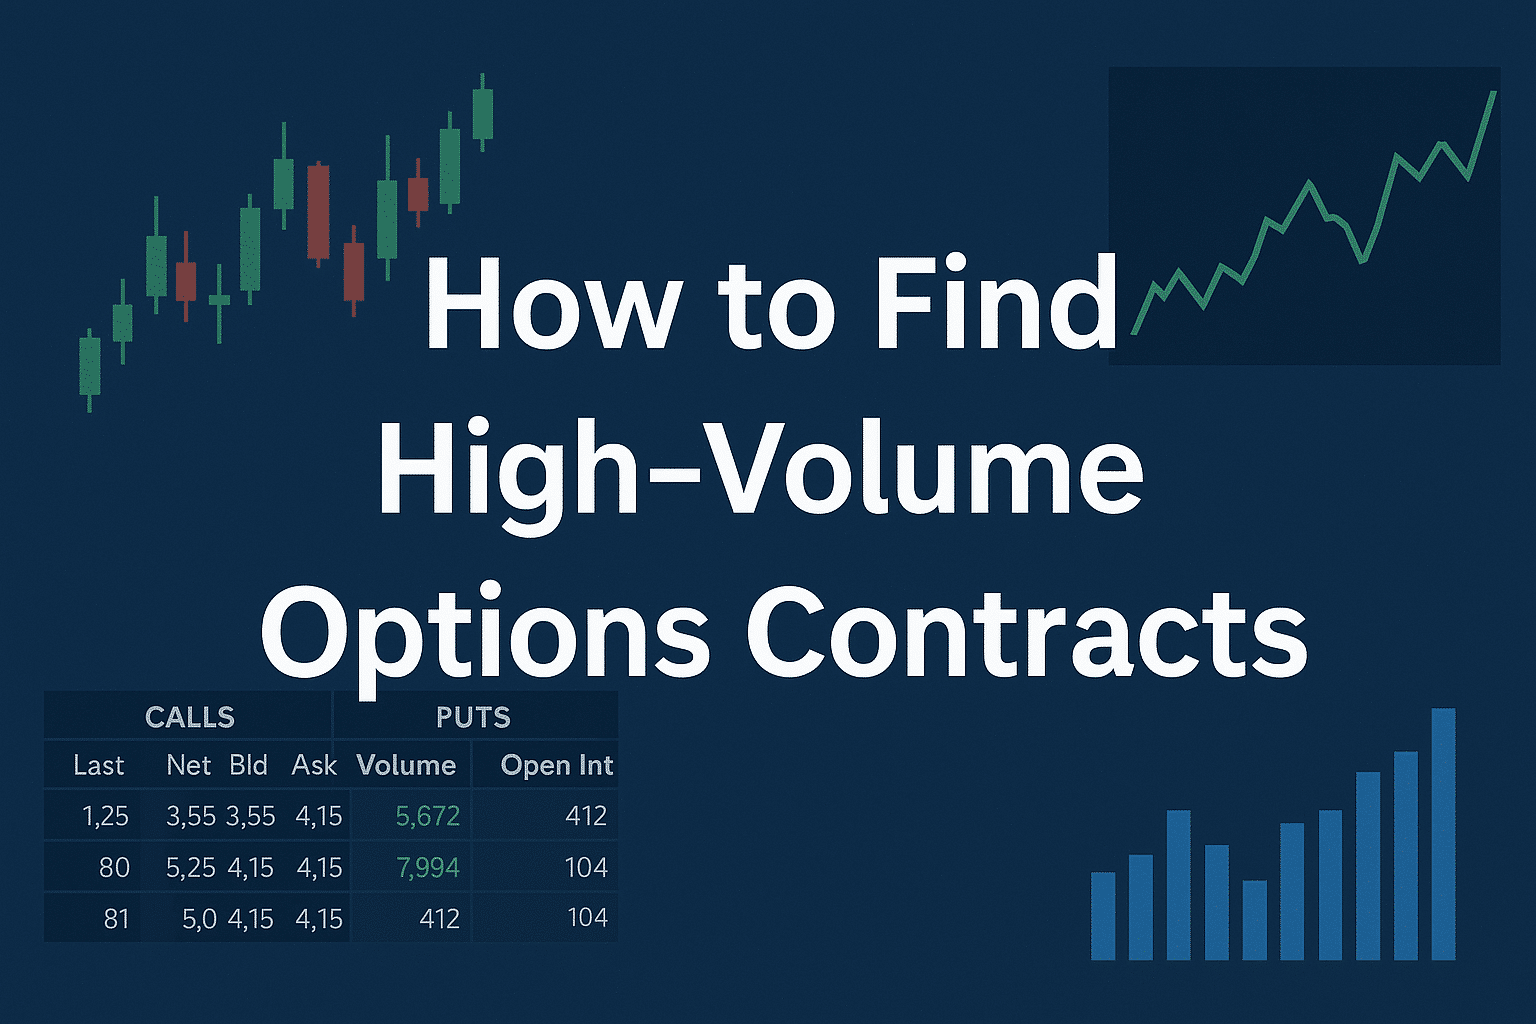
How to Find High-Volume Options Contracts (10 Best Ways for Beginners)
Have you ever wondered how to find high‑volume options contracts in the market? Finding options with lots of trading activity can help you spot where “the action” is. High-volume options are typically easier to trade and often signal heightened interest or big news around a stock. In this guide, we’ll walk you through 10 of the best ways to find high-volume options contracts in a natural, simple way.
We’ll use a friendly tone and even compare these methods side-by-side on key factors. If you’re new to options, don’t worry – this article is written so a 7th grader can understand it. (And if any terms confuse you, feel free to check out our Complete Beginner’s Guide to Options Trading for a quick refresher.)
Finding high-volume options is important because higher trading volume usually means an option is more liquid (easier to buy or sell without big price changes). Think of it like a busy marketplace – when lots of people are trading, it’s easier for you to find a fair deal. On the flip side, low-volume options can be harder to trade and often have wider bid-ask spreads (the difference between buy and sell prices). High volume can also be a clue that traders expect something big to happen with the stock, like an earnings surprise or other major event. In short, knowing how to find these active options can give you a trading edge.
Tip: Volume is the number of contracts traded in a day. Don’t confuse it with open interest, which is the number of contracts still open (not yet closed or exercised). A high volume today with relatively low open interest can mean new trades are flooding in!
Understanding High‑Volume Options Contracts
Before we dive into the how-to, let’s clarify what “high volume” means. An options contract is a financial agreement that gives you the right to buy or sell a stock at a set price by a certain date. Volume is simply how many of those contracts traded hands today. So if an option’s volume is 5,000, that means 5,000 contracts were bought or sold today. That’s pretty high, especially if normally only a few hundred trade in a day.
What counts as “high” volume? It depends on the stock. Options for popular stocks like Apple or SPY (an S&P 500 ETF) often trade tens of thousands of contracts daily. Smaller or less-known stocks might see only a few dozen. As a rule of thumb, anything significantly above the usual volume for that option is high. For example, if an option typically has 100 contracts traded a day but suddenly has 1,000 today, that’s a high-volume day. Heavy trading often comes with increased interest – traders might be expecting a big move or reacting to news. In these cases, the surge in trading can even drive the option’s price up or down more rapidly.
Why do we care about high-volume options? Liquidity. When lots of people trade an option, it’s easier to get in and out quickly. You won’t get stuck waiting to sell. High volume also usually means the bid-ask spread is small – you won’t lose much money on price gaps when buying or selling. Plus, heavy volume can validate that something real is happening; it’s not just one or two people trading in an empty room. In short, high-volume contracts are the ones with buzz and activity, and those are often where opportunities lie.
Tip: Always compare an option’s volume to its average volume or to the volume of other strikes on the same stock. An option trading 5,000 contracts might be high for one stock but normal for another. High volume is relative – look for unusual spikes compared to the norm.
Now, let’s jump into 10 easy ways you can find high-volume options contracts. We’ll go through each method, explain how to use it, and later we’ll compare them side by side on cost, ease, and more. Whether you have a fancy trading platform or just a web browser, there’s an approach here for you!
1. Use Your Broker’s Options Screener or Scanner
One of the best ways to find high-volume options is by using your broker’s trading platform. Most brokerages (like TD Ameritrade, E*TRADE, Fidelity, Robinhood, etc.) have built-in screeners or scanners for options. These tools let you filter and search through thousands of option contracts based on criteria you set – including volume.
How to do it (Step-by-Step):
- Step 1: Log in to your broker’s trading platform and find the screener or scanner feature. (It might be under a menu like “Research” or “Tools.” For example, TD Ameritrade’s thinkorswim platform has an “Option Hacker” scanner).
- Step 2: Set up a filter for volume. You can usually specify a minimum volume – e.g. “Show me options with volume greater than 1,000 contracts today.” You might also add filters like stock price or expiration date to narrow it down.
- Step 3: Run the scan. The system will return a list of option contracts that meet your criteria. For instance, you might see a list of calls and puts with volumes in the thousands.
- Step 4: Review the results. Identify which strikes (option prices) and expirations have the highest volumes. These are your high-volume options!
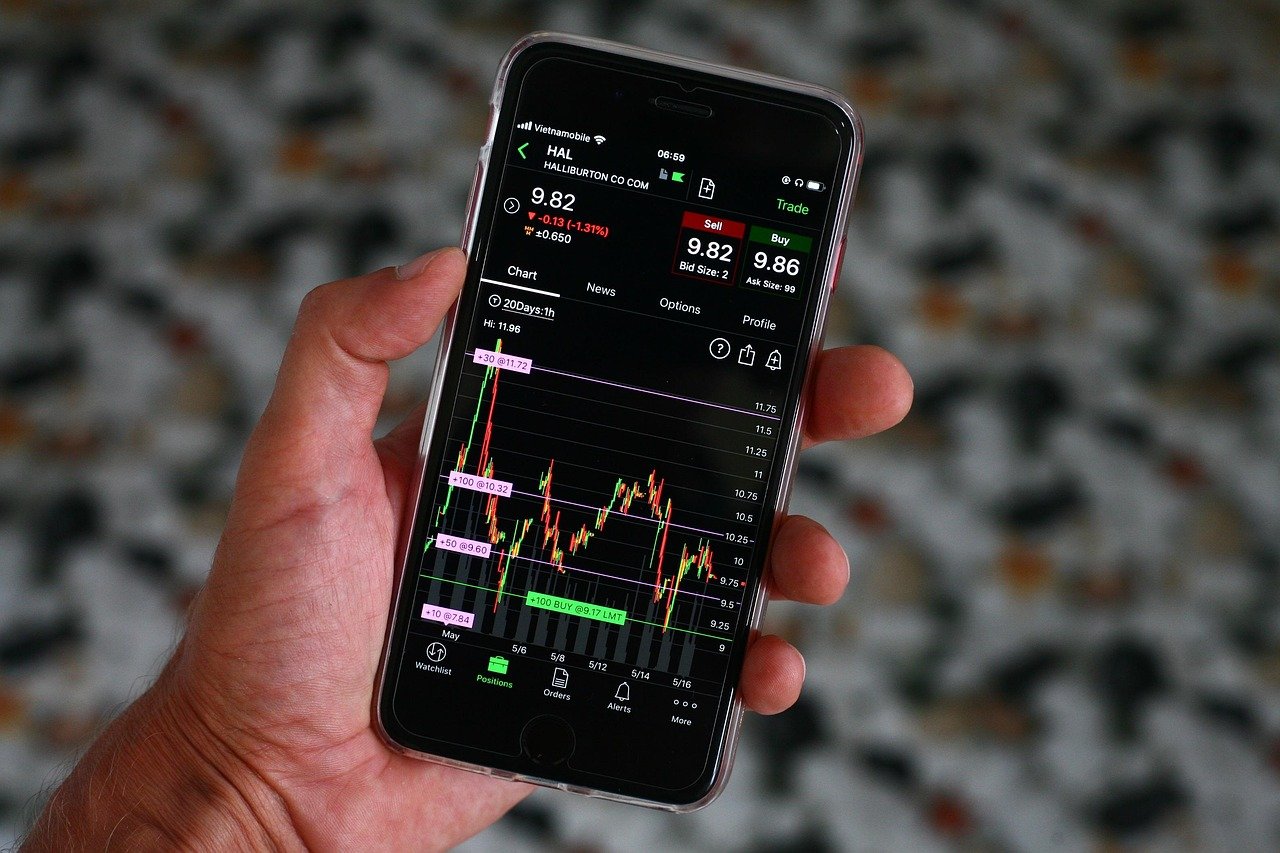
Example: A mobile trading app showing an option chain with call and put options. High-volume contracts are highlighted by a large number in the “Volume” column, indicating lots of trades today.
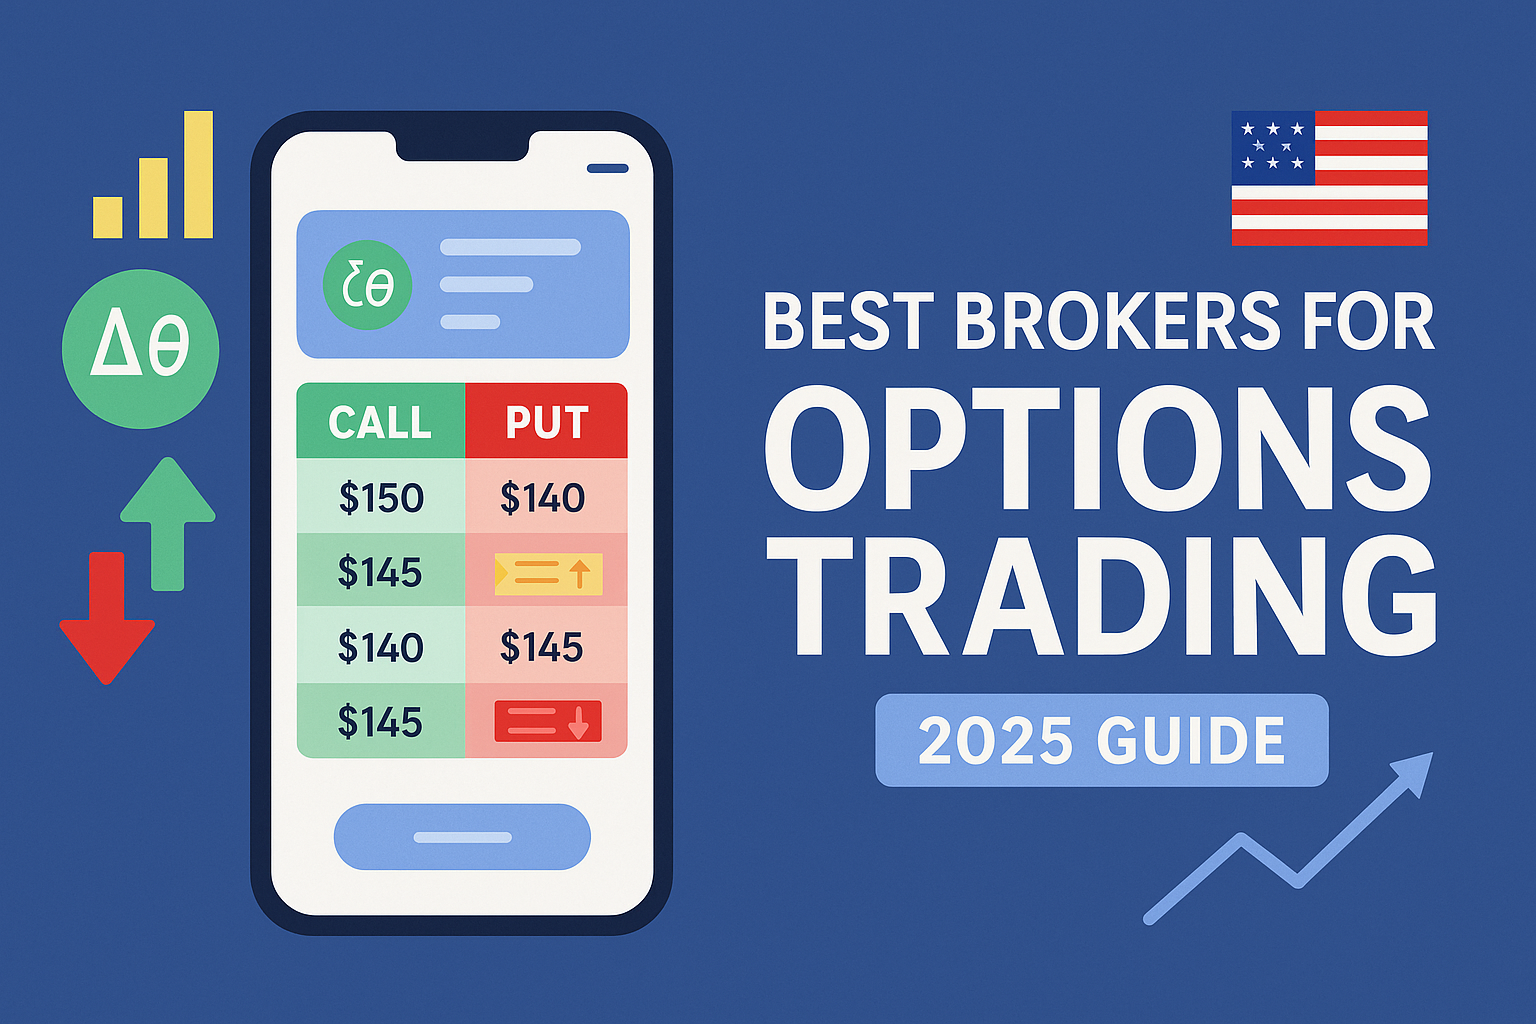
Using a broker’s scanner is powerful because it’s real-time data (during market hours) and you can customize it however you want. You can search for high-volume options on any stock or across the whole market. Some brokers even let you save scanners or set alerts. (Tip: Choose a broker with good scanning tools – see our list of Best Brokers for Options Trading in 2025 if you need recommendations on platforms with great options scanners.) The downside is you need a brokerage account and the interface can be a bit technical for beginners. But don’t worry: start with simple filters like volume and you’ll get the hang of it.
2. Check “Most Active Options” Lists on Financial Websites
If you don’t have a fancy platform or want a quick way, many financial websites publish daily lists of the most traded options. For example, Yahoo Finance has a Most Active Stock Options page that shows the top options contracts by volume each day. These lists typically highlight which stock’s options are hot and often list specific strike prices and expiration dates with the highest volume.
Using these lists is straightforward – just visit the site and see which options are at the top. You might see something like “Tesla 20 Oct 2025 $250 Call – Volume: 12,000,” which means a Tesla call option with a $250 strike expiring on Oct 20, 2025 traded 12,000 contracts today. That’s a high-volume option! Other sites with similar “most active options” lists include Nasdaq’s website and Barchart.
The benefit of these lists is simplicity – no login required, and you get an instant snapshot of where the action is. However, they usually only show the top 10 or 20 contracts. If you want to find high-volume options beyond those, you’d need to use a scanner or another method. Still, for a quick check of the biggest movers, these lists are super handy.
Tip: Keep an eye on these “most active” lists especially after the market opens and near the market close. Often, volume surges at the beginning and end of the trading day. You might notice the list updating with new options contracts as the day progresses.
3. Visit Barchart’s Option Volume Leaders Page
Barchart’s Option Volume Leaders page shows which stock and ETF options had the highest daily volume. This page breaks down options between stocks and ETFs for convenience. Volume is the total number of contracts bought and sold for the day for a particular strike price. Barchart even suggests comparing an option’s volume to the underlying stock’s volume for clues to its origin. For instance, if an option has huge volume but the stock itself is also trading like crazy, it might just be general market interest. But if the stock is quiet and an option’s volume spikes, it could mean traders are specifically betting on a move (this could be “unusual” activity). Barchart’s tool is free to use and updates during the day (with a short delay), making it a reliable resource to bookmark.
On Barchart’s Volume Leaders page, you’ll typically find a table listing something like: Stock – Option (Strike/Expiry) – Volume – Open Interest – etc. For example, it might show “AAPL – 21 Jan 2025 150 Call – Volume: 30,000” indicating Apple’s $150 call for Jan 2025 is extremely active. Using this list, you can quickly gauge which options are getting the most attention on any given day.
4. Try Market Chameleon’s Options Screener
Market Chameleon is another website that offers an advanced options screener and volume-tracking tools. They have a section for unusual options volume and various filters to drill down into data. Market Chameleon can show, for example, options that traded at multiple times their average volume or contracts with high volume relative to open interest.
To use it, go to their options screener and set filters similar to what we did with the broker scanner. For instance, you might filter “Volume ≥ 500 AND Volume > 2× Average Volume.” This would show contracts where today’s volume is at least 500 and more than double what’s typical – a sign of unusual activity. The site also provides a Stock Option Volume Report that highlights big volume increases and even volume imbalances between calls and puts.
Market Chameleon may require a login (free or paid) for some detailed data, but the information they give is quite rich. It’s a bit more advanced, but very useful if you want to dig deeper into volume patterns. For example, you could discover that a certain stock normally has low option interest, but today one of its call options exploded with trades – a potential signal to investigate that stock further.
Tip: When using advanced screeners, don’t go overboard with too many filters at once. Start with one or two key criteria (like volume and expiration date). If you pile on too many conditions, you might accidentally screen out some interesting high-volume options. Keep it simple to catch the big moves.
5. Monitor Unusual Options Activity Tools
High volume is often linked to unusual options activity – basically, options trading that stands out from the norm. There are specialized tools and services that track unusual options trades in real time. For example, OptionStrat offers a real-time unusual options flow tool, and Unusual Whales (a popular service among traders) tracks large or atypical trades as they happen. These tools often show when someone places a very large order or when volume on an option is extremely high compared to its history or open interest.
Using these tools, you might see alerts like “🔔 Large Call Purchase: 5,000 contracts of XYZ $50 Call expiring next month” or “🔔 Unusual volume: ABC $20 Puts trading 3000% of normal volume today.” Such alerts tip you off that something noteworthy is happening. Some platforms are paid, but they often provide limited data for free or share notable alerts on social media. Even following a Twitter feed or a finance forum that discusses unusual options can give you leads.
The advantage here is timeliness – you learn about high-volume action as it’s happening, not just at day’s end. This is great if you want to act quickly or stay informed about potential big moves. The downside is you might need a subscription for full details, and not every unusual volume spike leads to a profitable trade (sometimes it’s just a hedge or one big fund’s transaction). Still, if you’re keen on catching big trades in the moment, these tools are incredibly helpful.
6. Focus on Popular Stocks and ETFs
Another straightforward method: look at popular stocks or ETFs known for high options volume. Certain names are favorites among options traders, so their options naturally have high volume every day. Examples include: SPY (S&P 500 index ETF), QQQ (Nasdaq 100 index ETF), AAPL (Apple), TSLA (Tesla), AMD, AMZN, and so on. These big-tech stocks and broad ETFs often dominate the volume charts.
If you check the option chain for any of these, you’ll see many strikes with thousands of contracts traded daily. You don’t even need a special tool – just knowing the usual suspects helps. For instance, SPY (being a broad market ETF) regularly has enormous volume on both calls and puts at many strike prices. So if your goal is to trade something liquid, focusing on these tickers is a good start.
To use this method, you could:
- Pick a popular stock or ETF (say, Apple or SPY).
- Pull up its option chain (on your broker’s app or a site like Yahoo Finance).
- See which strike prices have the highest numbers in the Volume column. Those are the high-volume options for that underlying on that day.
The benefit of sticking with popular names is reliability – you’re almost guaranteed plenty of liquidity. However, remember that high volume on these names is sometimes just routine and might not indicate a special event (because they’re always active). Still, if you’re learning, it’s safer to practice with options that have lots of volume on big-name stocks than to dabble in obscure ones with little trading.
Tip: A good exercise for beginners is to daily check one or two big stocks’ option chains. You’ll start to get a feel for which strikes traders focus on (often at round numbers like $50 or $100, or near the current stock price). Over time, you’ll notice patterns – for example, certain expiration dates (like the monthly options) tend to attract more volume.
7. Look at Volume vs. Open Interest (Unusual Volume Spikes)
Sometimes an option has high volume compared to its open interest – that can be a major red flag (or green flag!) of unusual activity. Open interest is how many contracts are currently open (not yet closed out). If an option’s volume in a day is higher than the total open interest it had before, it suggests a lot of new positions are being opened that day.
For example, say an option had an open interest of 200 contracts (meaning before today, 200 contracts were open) and suddenly today the volume is 1,000. That daily volume is 5× the open interest – a significant jump. It could mean new information is out or big traders are piling in. Barchart’s Unusual Stock Options Activity scan looks for exactly this kind of thing: options trading at much higher volume relative to the contract’s open interest.
How can you use this? Many screeners (including some broker platforms and free sites) allow you to filter where Volume is greater than Open Interest, or they show a volume/open interest ratio. Even without a scanner, you can spot it by comparing the columns on an option chain. If you see Volume = 5,000 and Open Interest = 300 on a contract, that stands out as unusual.
Be cautious though: sometimes volume spikes are due to traders closing out positions or rolling them (moving to a different strike), so it’s not always new bets. But more often than not, a high volume vs low open interest scenario is worth a closer look. It’s a clue that something unusual happened today with that contract, and you might want to investigate why.
8. Set Alerts for High Volume
If you want to be proactive, consider setting alerts for unusual volume. Some trading platforms let you create alerts that notify you (via pop-up or email) if a certain condition is met. For instance, you could set an alert: “Notify me if any option on XYZ stock trades more than 2,000 contracts in a day.” This way, you don’t have to constantly watch – you’ll get a ping when there’s a big jump in volume.
Not all brokerages support custom option alerts, but if yours does, it can be very handy. Alternatively, a low-tech approach is to simply check at set times of day. For example, look at the morning’s most active options (using method #2 or #3) and then check again in the last hour of trading to see what ended up being the top volume contracts.
There are also newsletters and daily recap articles on sites like Benzinga or MarketWatch that sometimes highlight the day’s most active options or notable unusual trades. Subscribing to those can indirectly alert you to high-volume contracts (often by the next morning if not the same day).
Setting alerts can save you time and ensure you don’t miss something big. Just be mindful of the settings – too many alerts might overwhelm you, so choose your triggers wisely (like truly high numbers or specific stocks you care about).
9. Follow Market News and Social Media
Believe it or not, Twitter (X) and Reddit can be surprisingly useful for catching high-volume options chatter. Many traders and market analysts post when they notice unusual volume or big trades in the options market. For example, someone might tweet “Lots of bullish call buying in XYZ today 👀” which can tip you off before you see it on a scanner.
News outlets sometimes report on options activity as well. You might see a headline like “Heavy trading in Netflix puts ahead of earnings” on a finance site. This basically means “Netflix’s put options had high volume today,” and it gives you both the fact and the context (ahead of earnings, in this case). By reading such stories, you not only learn which contracts had high volume, but often why.
Using social media or news is a more qualitative approach – it doesn’t give you a neat list of numbers like a scanner does, but it provides context. It’s especially useful to understand the why behind the volume. For instance, if everyone’s talking about high volume in calls for a company that’s rumored to be a takeover target, you get the story behind the trades, not just the data.
If you go this route, just ensure the sources are credible. Stick to well-known financial commentators or official news feeds to avoid misinformation. And always double-check for yourself – if Twitter says “ABC options volume is off the charts,” you can verify by looking at ABC’s option chain to see the actual numbers.
Tip: As a beginner, it’s fine to use news as a guide, but always verify the information. If you read about “unusual options activity” in an article, try to find that option on your own and see its volume and price action. It’s a great way to learn by doing, and it helps you trust but verify.
10. Practice with a Paper Trading Account
Finally, consider using a paper trading account (trading simulator) to practice finding and even “trading” high-volume options without risking real money. Many broker platforms offer a paper-trading mode with real market data. Why is this helpful? Because you can test out all the methods above in real time and see how it works in practice.
For example, in a paper account you can:
- Use the broker’s scanner to find high-volume options, and even place a mock trade to see how quickly it fills. High-volume contracts should execute quickly at prices close to the market price.
- Observe how high-volume options behave during volatile periods. Do their prices change rapidly? Do the bid-ask spreads stay tight when volume is high?
- Experiment with setting alerts or comparing multiple sources (like cross-check a scanner’s results with a website’s top list) to see which method you prefer.
Paper trading will boost your confidence. When you switch to real money later, you’ll already know how to navigate the tools and interpret the volume data. It also reinforces learning – the more you actively search for high-volume options, the more familiar you become with the market’s rhythms.
Most importantly, paper trading lets you make mistakes and learn from them. Maybe you’ll chase an option that had high volume but also huge volatility and it swings against you – better to learn that lesson with virtual dollars! Over time, you’ll develop a sense for which high-volume situations are worth acting on.
Side-by-Side Comparison of Methods
We’ve covered 10 methods – now let’s compare them on a few key factors: ease of use, cost, data detail, and speed.
- Broker’s Scanner (Method 1): Ease: Moderate (need to learn the tool); Cost: Free with account; Data Detail: High (you can customize and scan the entire market); Speed: Real-time results during market hours.
- Most Active Lists (Method 2): Ease: Very Easy; Cost: Free; Data Detail: Low (only shows top 10–20 options); Speed: Near real-time (updates throughout the day).
- Barchart Volume Leaders (Method 3): Ease: Easy; Cost: Free; Data Detail: Medium (shows top volumes and some context info); Speed: Intraday updates (about 15-minute delay).
- Market Chameleon Screener (Method 4): Ease: Moderate/Hard (advanced interface); Cost: Free basic, Paid for full access; Data Detail: High (lots of metrics like average volume, ratios, etc.); Speed: Intraday (some live data, some delayed).
- Unusual Activity Tools (Method 5): Ease: Easy (they highlight the unusual stuff for you); Cost: Often Paid (some free alerts); Data Detail: High (detailed info on specific big trades); Speed: Real-time alerts.
- Popular Stocks/ETFs (Method 6): Ease: Easy; Cost: Free; Data Detail: Medium (you still have to interpret the option chain); Speed: Real-time (as fast as you can check the chain).
- Volume vs OI Spike (Method 7): Ease: Moderate (requires some analysis or a specialized scan); Cost: Free (using available tools or manual checking); Data Detail: High (focuses on unusual new activity); Speed: End-of-day for most free data, real-time for premium scans.
- Alerts (Method 8): Ease: Varies (if platform supports it, setup can be easy; if not, it’s not available); Cost: Free (on most platforms); Data Detail: Low (just notifies you of the event); Speed: Real-time.
- News/Social (Method 9): Ease: Easy; Cost: Free; Data Detail: Low/Medium (qualitative insights, not comprehensive data); Speed: Fast for breaking news, but info may be fragmented.
- Paper Trading (Method 10): Ease: Easy (if you have a good platform); Cost: Free; Data Detail: Same as real tools (you’re using actual market data); Speed: Real-time (simulated trades happen with live data).
As you can see, if you want the most detailed and immediate data, a broker’s scanner or a premium unusual flow tool is hard to beat. For simplicity and zero cost, checking free websites or sticking to well-known stocks works well – you might not catch every niche opportunity, but you’ll see the major action. Many beginners start with the free methods to get comfortable, then gradually incorporate more advanced tools as they gain experience.
The “best” method really depends on your needs. Are you a casual investor just looking to see where the big trading interest is? Then Yahoo’s most active list or scanning a couple of popular stocks might be plenty. Are you an active trader hunting for the next big move? Then you’ll likely benefit from using scanners, alerts, and unusual activity trackers to stay on top of things.
Conclusion
Finding high‑volume options contracts doesn’t have to be complicated. We’ve explored 10 different ways – from using your broker’s scanning tools to simply eyeballing a list on a website. The key takeaway is that volume is your friend: an option with high volume usually means it’s liquid and there’s significant interest in it. This often leads to better trading opportunities and smoother trade execution.
For beginners, start with the easy methods. Check the most active options lists, look at options on well-known stocks, and see how volume compares across strikes and expirations. As you get comfortable, experiment with more advanced techniques like custom screeners or unusual activity alerts. Remember, every expert trader was once a beginner who had no idea what option volume meant – so you’re not alone in learning this!
Please visit Academic Broadcasting Platform for getting more information about option trading.
Stay curious and keep practicing. Over time, you’ll be able to quickly spot where the “hot” action is in the options market just by glancing at volume numbers. And always keep learning: the market is always evolving, and so will your skills. High-volume options can be exciting to trade, but always make sure you understand the risks and have a plan.
Happy trading, and may your volume always be high and your spreads always be tight!